My first exposure to proper analytics started during my summer internship, i opted to do my internship for a Internet service provider in Gujarath , where i was given a problem statement " What does the customer expect from ******" so as a duitiful MBA student i prepared a questionnarie with 25 questions based on all the various parameters listed by textbooks, and visited each and every customer of the ISP in the city and started the data collection.
Years later when i think of the analysis i did i am amazed on how much the things have changed and how the basics still is relevant. "Data" it is the most important component even today. Three major lessons from the data collection, not all questions were not applicable to all customers, there was lots of empty responses, some questions asked which tried to get additional qualitative information lead to respondents being confused and giving conflicting answers to supporting questions. Respondents were not paitent enough to read through the 15 questions and respond properly. So how would have i done this differently ?
- Categorize the customers into relevant groups and prepare questionnaire relevant to each group, thereby reducing blank responses
- Group related questions into sections and create a hiearchial question block.
- Limit the research objective and keep the questions under 15 and conduct interviews with select customers to get more information.
This experience of doing data collection lead me to think how can i automate this process and can i make this easy, my research introduced me to online forms (Survey Monkey, Google Forms). This was a great eyeopener to me, i was first exposed to vizualization and automated insights generation . Once a survey was notified as completed it automatically creates a master data set and also a report . Each and every question was statistically analysed and the important trends highlighted. This experience pushed me to further search for online analytics and it did not diappoint me.

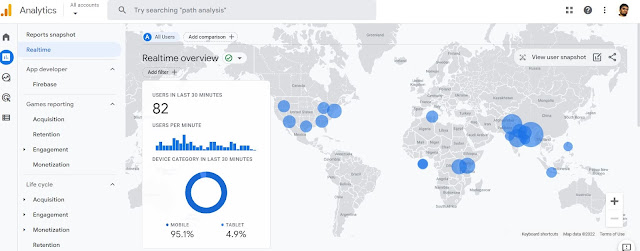
Enter Google Analytics , I was reading an article about digital advertising and how google is leveraging the data from search to created targeteded advertising , so i started to search and read more about it, while learning about this i came across Google Analytics, it promised that if you have a website or a blog you can find out how many people visit your site and the geograpic location of your audience. I was hooked, i was writing a blog about various topics related to MBA and wanted to increase my audience, so i added my Blog to Google analytics and started to analyse my audience . This was an interesting experiment, i came to understand what topics were driving visitors to my blog and how i can improve the content to increase page views and drive traffic.These simple day to day interactions with various kinds of analytics, played a major role in my growth as an Data Analyst /Intelligence Specialist, i got confidence to do analysis and explore new technologies, i came to understand the endlesss possibilities of analytics and most important of all the importance of quality data. So if you are wondering on how to start your data analysis journey, start with the simple things, your college project, a survey in your neighbourhood ,your social media account and then move on to the popular tools and technologies available.
Thanks for your time, do share your feedback and inputs
Websites Mentioned in Article
My Blog
Google Analytics
Survey Monkey
Thanks for your time, do share your feedback and inputs
Websites Mentioned in Article
My Blog
Google Analytics
Survey Monkey


